

Contents
- General
- The components of the Break-Even Point
- Calculating the Break-Even Point
- The Break-Even Point as a productivity indicator
- The Break-Even Point in Budgeted & Actual terms
- Real Case Studies
General
The business lives in a dynamically changing environment. Whatever we budget for it has some probability of happening. Within this uncertainty, it makes sense to calculate certain financial figures with reverse logic.
One of them is the Break-even point of the business’s operation.
The Break-Even Point of a Business is the level of Sales (Turnover) which, if the Business achieves it, covers all its expenses, that is, it makes neither a profit nor a loss. It makes a profit beyond that point.
‘Neither up nor down’ in common parlance, as someone aptly remarked.
It is expressed in various ways:
- As a value of sales: At what level of sales (turnover) the business makes neither a profit nor a loss
- As a percentage % of Sales: At what percentage of forecast sales the business makes neither a profit nor a loss
- As a quantity of Sales: How many pieces (or other unit of measure) the business must sell to make neither a profit nor a loss
- As time: Over a one-year horizon, how many months the business will need to achieve the sales that bring it to the point of making neither a profit nor a loss
It is obvious that the lower the break-even point, the better for the business. With a low Break-even point the business is more stable. This is because it covers all its expenses with fewer sales and makes a profit from that point onwards.
The components of the Break-Even Point
It follows from the above that the components of the Break-Even Point are Sales (turnover) and Expenses.
Not all expenses, however, are of the same “quality”. They are divided into fixed expenses and variable expenses.
Fixedexpenses are those that run in any case, regardless of whether the business is operating or not.
One way to picture this is to imagine the business closed for some reason, e.g. a holiday.
Let us consider which expenses keep running.
What runs, then: Rents, Salaries etc.
Variable expenses are those that run as long as the business is operating (of course the fixed ones, which we have separated out, run too).
One way to picture this is to imagine the business in operation, e.g. on any given day.
What runs, then: Electricity, Consumables, Telephones etc.
What runs, then (on top of the fixed expenses), are the expenses created by the fact that the business operates and sells products
Calculating the Break-Even Point
If we assume, without loss of generality, that we have one product and express the variable cost per unit of product, we have:
Variable cost = X units of product * Cost of product per unit
Where the unit cost includes both the acquisition cost (production or purchase) and the share of variable expenses attributable to the unit of product.
Based on the above, the cost of the business can be expressed as follows:
Cost = F + V = F + X * UC
Profit is: Sales – Cost = X*P – F – X * UC = X * (P-UC)-F
Where:
- X is the units (or other unit of measure) of the product sold
- P is the selling price
- F is the fixed expenses
- UC is the unit cost (production or purchase, plus the variable expenses attributable to each unit)
Profit is therefore greater (apart from the selling price P and the quantity sold X) when the business has: Low Fixed expenses F, and a Low cost per unit (of purchase or production and the related variable expenses)
From the above, and given that by the definition of the Break-Even Point we want: Profit = Sales – Cost = 0, we have
X * (P-UC) – F=0 => X * (P-UC) = F => X = F / (P-UC)
So the Break-Even Point, expressed as the required quantity of sales, is:
Break-Even Point as required quantity of Sales:
X = F / (P-UC)
The same relation, multiplied by the selling Price, gives us the Break-Even Point as the required value of sales (required turnover)
X*P = F*P /(P-UC) and finally, after a little algebra:
Break-Even Point as required Sales (turnover):
S = F / (1-UC/P)
If we expressed the above sales in months and counted them from the beginning of the year, then if, for example, we achieved the sales required for the Break-Even Point by September, this would be interpreted as follows:
“By September, the business has achieved enough sales to cover all the Fixed expenses up to the end of the year as well as the variable expenses of those sales (up to September), and from here on, for as long as it sells, it earns the entire profit contributed by each unit sold, that is, the profit: Selling price – Cost (of production or purchase and the related variable expenses such as commissions etc.)”
With some further algebra, the Break-even point as a percentage % of forecast sales is calculated as:
Break-Even Point as a percentage of forecast Sales:
B.E.P.=Fixed expenses / (Sales – Variable expenses) * 100%
which is also the most usual form.
The Break-Even Point as a productivity indicator
The Break-Even Point can also be understood as a general productivity indicator of the business, because it shows us what % of sales is consumed by costs in a given period (year); so the lower the business manages to keep it, the more productive it can be considered (Cost per Year)
Thus, if we measure the Break-Even Point in different periods (Years), we can see how much more productive the business is becoming, provided of course that it falls over time, which is interpreted:
A) As more rational Management of the Business, with proper management of Fixed Expenses which, through good decisions, e.g. technological ones (such as Efficient Investments etc.), fall or rise at a lower rate than Sales.
B) As production or purchase of products at lower cost and hence with a larger profit margin
The Break-Even Point in Budgeted & Actual terms
The Break-Even Point is calculated both in Budgeted and in Actual terms.
In budgeted terms it is calculated with the Annual Business Plan (BUDGET) for the year.
For example:
Suppose budgeted Sales are S=1,000,000 Euros for the year
Suppose Fixed expenses (Salaries, Rents etc.) are F=200,000 Euros
Suppose the variable expenses (Cost of Goods Sold and other Variable expenses) corresponding to the budgeted sales of 1,000,000 Euros are: V=600,000 Euros
Then the Break-Even Point is:
B.E.P.= F / (S-V) = 200,000 / (1,000,000 – 600,000) * 100% = 50%
Which means that if the Business achieves half the sales it budgets, it will neither gain nor lose.
In value of sales this is 50% * 1,000,000 = 500,000 Euros, which is shown as follows:
Break-Even Sales = 500,000 Euros
Fixed Expenses = 200,000 Euros
Variable Expenses = 50% * 600,000 = 300,000 Euros (the corresponding amount of variable expenses)
So we have Total Expenses = F + V = 200,000 + 300,000 = 500,000 Euros,
that is, equal to the Break-Even sales
It is obvious that if it achieves all the sales it budgeted, it will earn: Profit = S – F – V = 1,000,000 – 200,000 – 600,000 = 200,000 Euros.
Real Case Studies
The following pages present two examples from real business cases.
The first concerns calculating the break-even point in budgeted terms when drawing up the Annual Business Plan (BUDGET), and the second in actual terms from the annual financial statements, Balance Sheets and Income Statements, with certain assumptions
They are accompanied by the corresponding charts
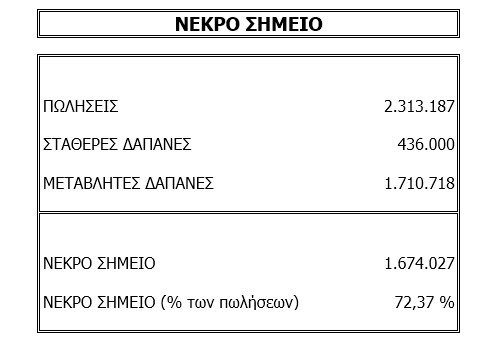 Break-Even Point of a Business in Budgeted terms
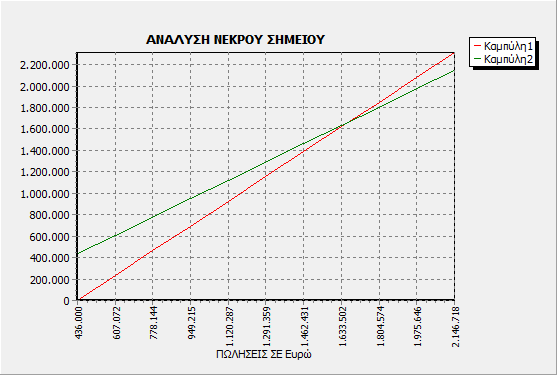 Chart of the Calculation of the Break-Even Point
Presentation over time of the Actual Break-Even Point of the Business
With data from the annual Balance Sheets and Income Statements
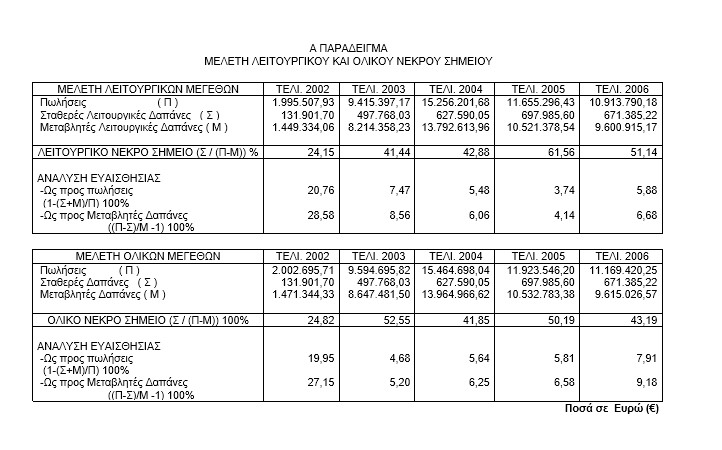
The table above shows that in the first years the Business was becoming less productive, while from the last year the course was reversed and it became more productive.
As one would expect, the business reduced both fixed and variable expenses (between 2006 and 2005)
The result was that, despite the fall in sales from 11,655,296.43 to 10,913,790.18, it made a larger operating profit:
Profit 2005: 11,655,296.43 – 697,985.60 – 10,521,378.54 = 435,932.29
Profit 2006: 10,913,790.18 – 671,385.22 – 9,600,915.17 = 641,489.79
On the next page the above is also presented in chart form.
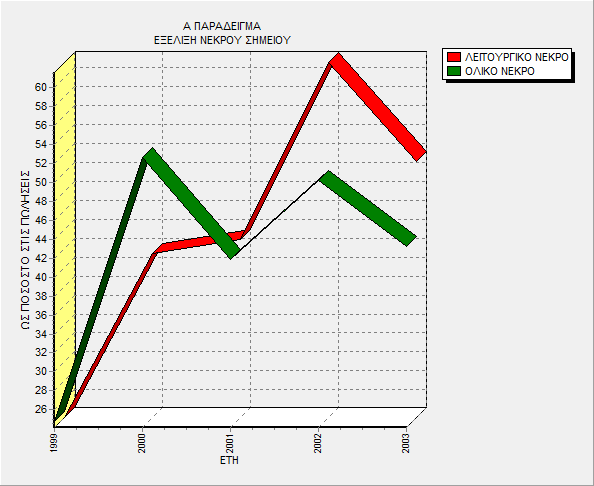
Change over time of the Break-Even Point of a Business
Calculating and studying the Break-Even Point of the Business is essential both for what is discussed in this article and for what will be discussed in a later one, where using the Break-Even Point can lead to very serious sensitivity analyses of the Business and to more rational management decisions on many matters, such as pricing products with a controlled result etc.
The Company Specisoft S.A.
Specisoft S.A. was founded in 1987 as a specialised software development company, its main characteristic being the development of software on subjects involving knowledge, high specialisation, special optimisation algorithms and very large-scale data processing.
The subjects of the programs (among others) concern a) Business software (Business Planning – Business Plan, Financial Analyses of Balance Sheets, Business Valuation, Standard Costing, Forecasts, Investment Appraisals etc.), b) Financial software (Fundamental Analysis, Portfolio Selection etc.), c) Business Games (Business Simulators), d) Optimisation of Economic Problems, e) Educational software on the above subjects.
The programs run on WINDOWS locally, on a network and over the INTERNET.
Almost all the company’s employees are university graduates. In addition, the company employs specialised, highly experienced external associates holding postgraduate degrees (Master’s and PhD) and has University professors as advisers.
The company’s customers are Businesses, Business Consultants, Accounting firms, Public Organisations, Municipalities etc. Among its customers (the company has more than one thousand seven hundred) are many of the largest Greek companies, more than eighty-five of them listed on the Athens Stock Exchange.
A very important part of the company’s customer base is the Greek Higher-Education Institutions (universities and technological institutes), Vocational Education (Public and Private vocational institutes), Colleges, Seminar Organisations, Vocational Training Centres etc., which equip their laboratories with the company’s programs, used directly in the training of their students.
Specisoft, with its software technology, its specialised optimisation algorithms and the knowledge of specialist financial subjects that it embodies in the software it produces, can be described as a knowledge company within the emerging knowledge economy.
Specisoft S.A.
17 Pergialitou St., 15451 Neo Psychiko
Tel: +30 210-6911468, Fax: +30 210-6993791
e-mail: info@specisoft.gr, SITE: www.specisoft.gr